Which genes and pathways drive clustering of basal breast tumors?
Objective
Use sorting of attributes to identify genes and pathways driving clustering of basal breast tumors.
Skills Covered
- Sign into the TumorMap.
- Creating a new group from an existing categorical (multi-valued) attribute.
- Running statistical test to order attributes based on their differential presence/absence in one group versus another.
Steps
- Click Sign In at the far upper right and enter your credentials. You must be signed in to complete this tutorial. Also, your account must have authorization to run compute-intensive jobs. You can ask for authorization from hexmap at ucsc dot edu.
- With the map, Pancan12/SampleMap, make sure the mRNA layout is selected and only Tissue is selected in the Short List. Observe that breast tumors are in blue on the bottom right of the map.
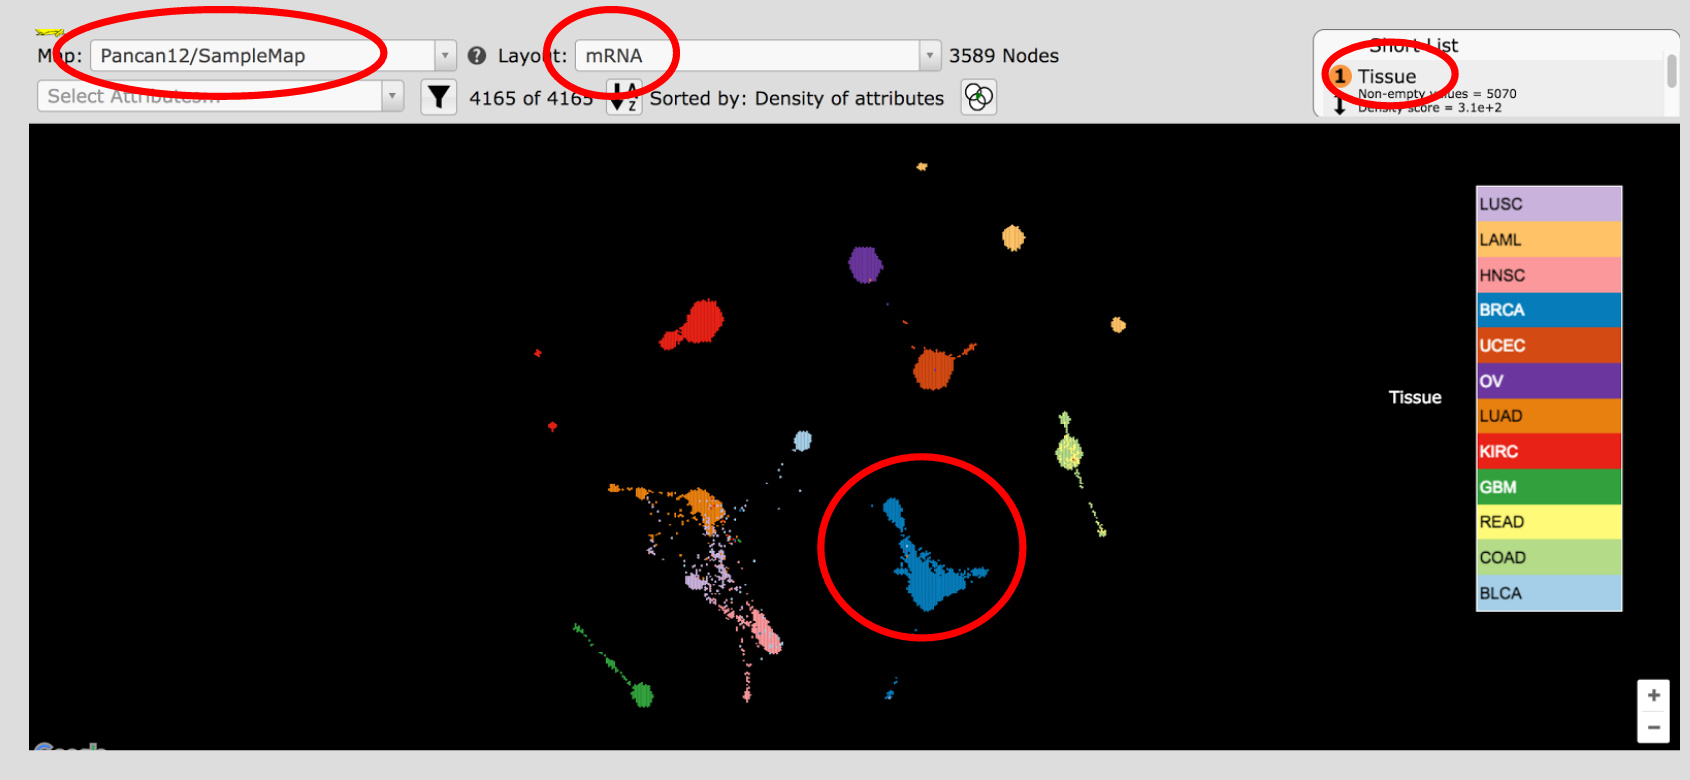
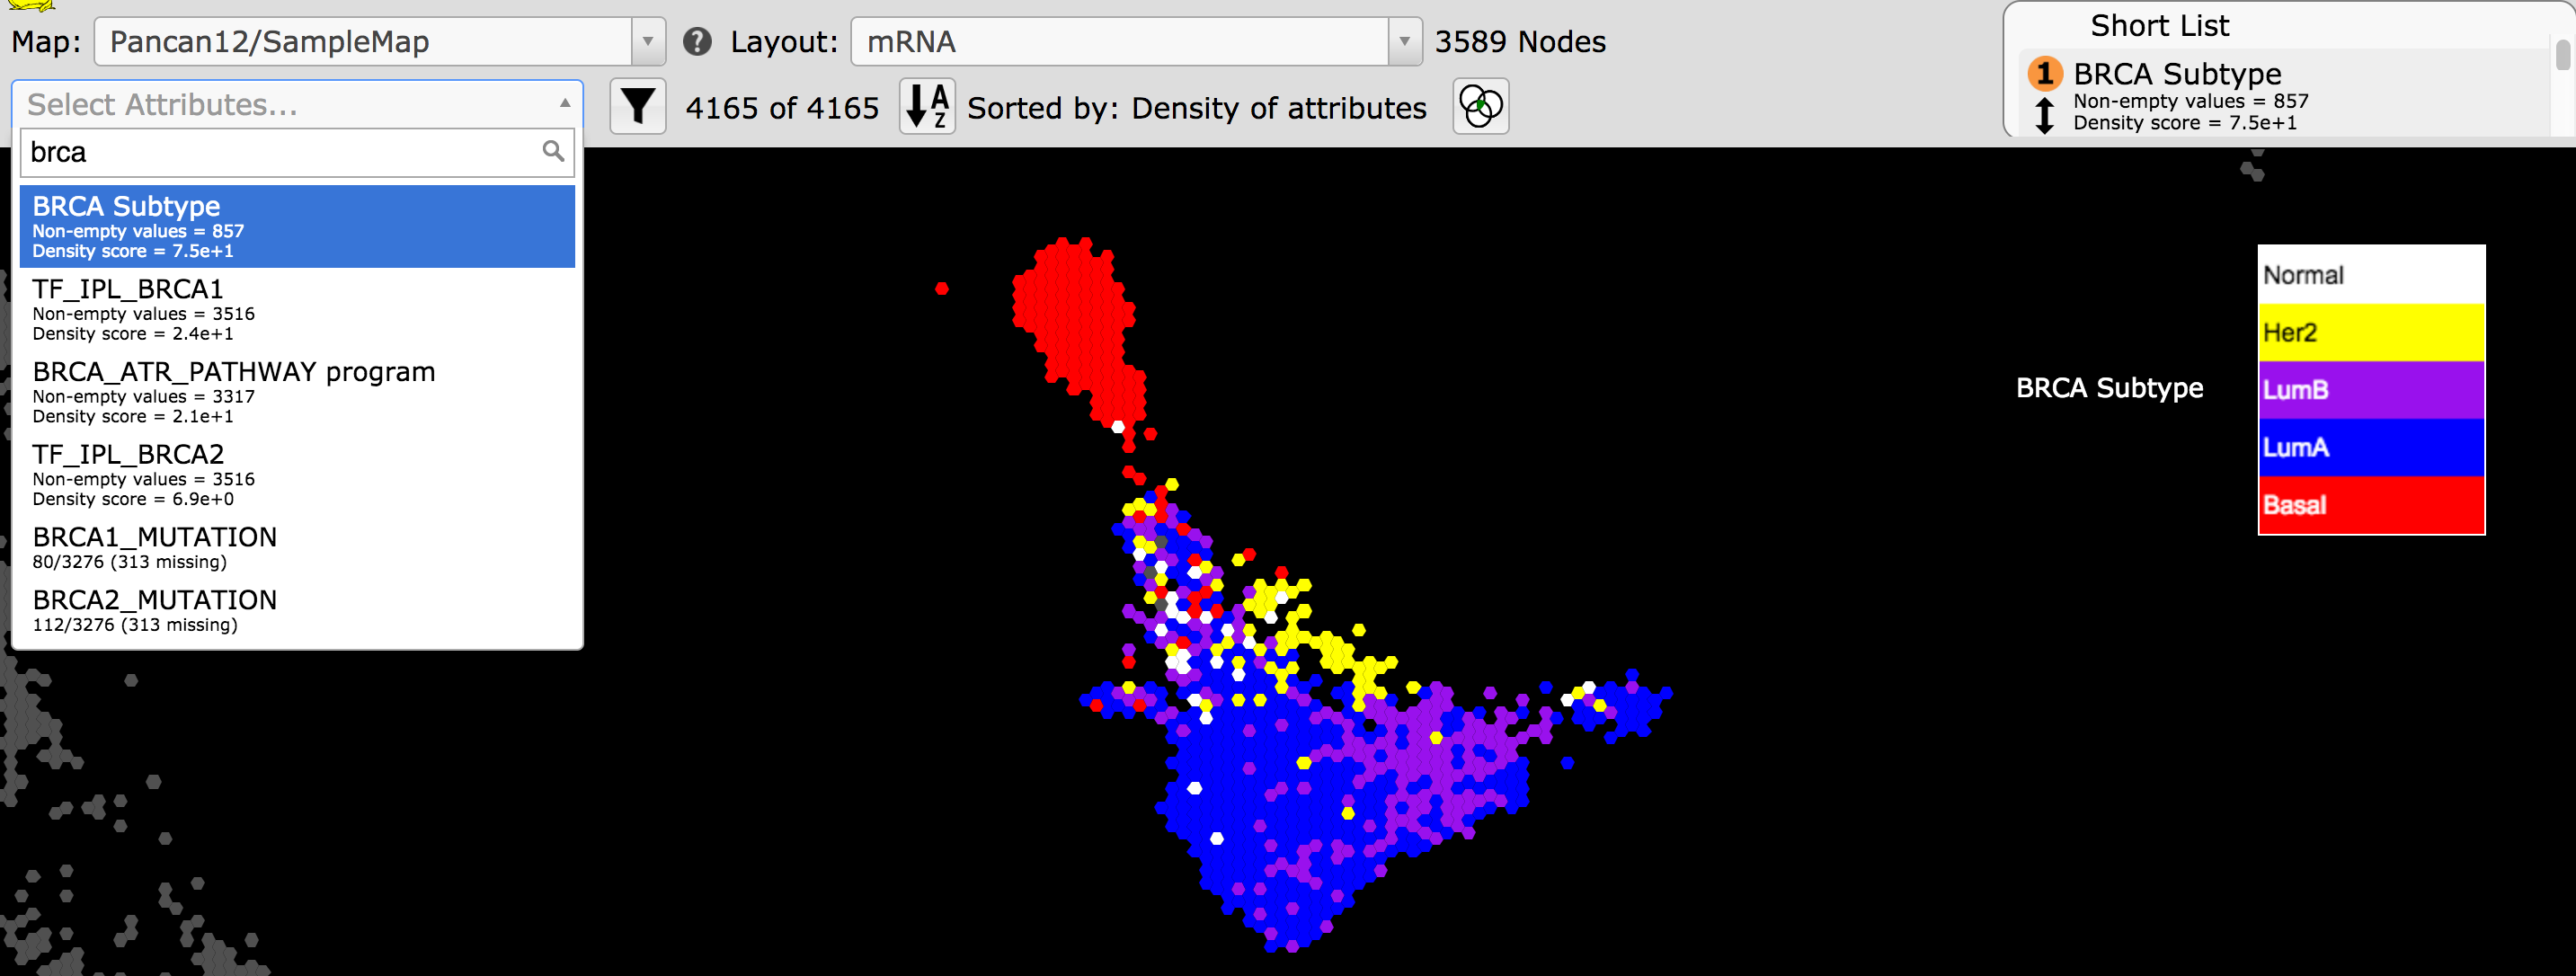
- In Select Attribute type in brca and click on BRCA Subtype.
Observe that the breast tumors are colored by the molecular subtypes.
Use the
 on the bottom right of the screen to zoom into
the BRCA island. Click and drag to move the image.
on the bottom right of the screen to zoom into
the BRCA island. Click and drag to move the image.
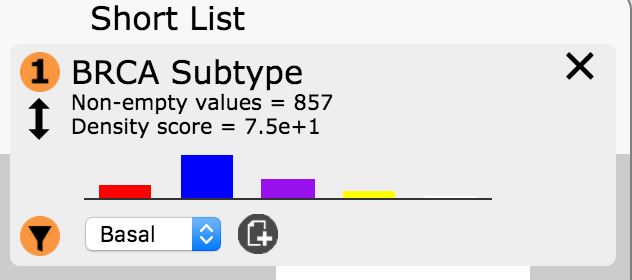
- In the Short List BRCA Subtype entry click on the filter button
 and select Basal in the drop down menu. Then
click the create attribute button
and select Basal in the drop down menu. Then
click the create attribute button  . Name this attribute.
Basal_BRCA.
. Name this attribute.
Basal_BRCA.
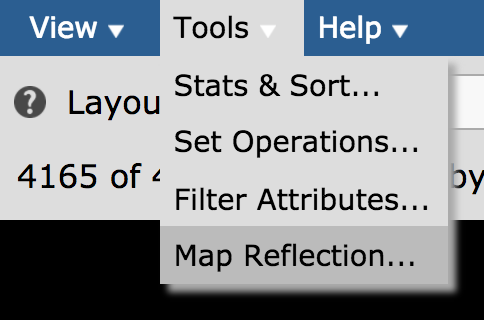
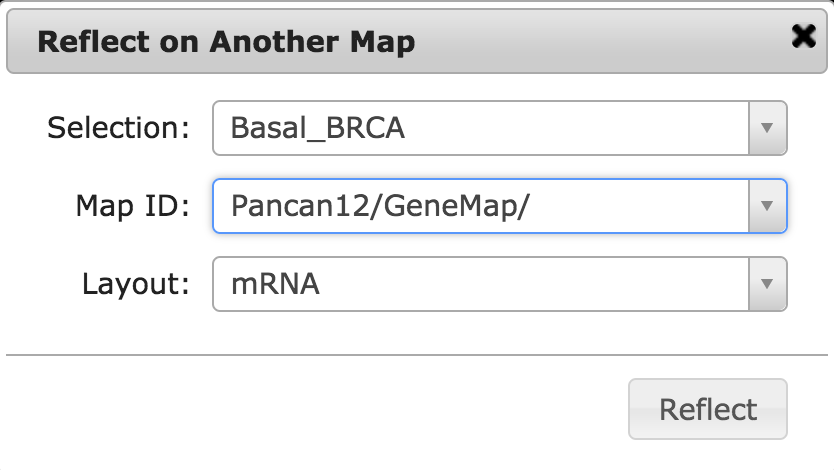
- Hover on the Tools menu then click on Map Reflection.
- In the Reflect on another Map window make sure the values are selected as below and click Reflect.
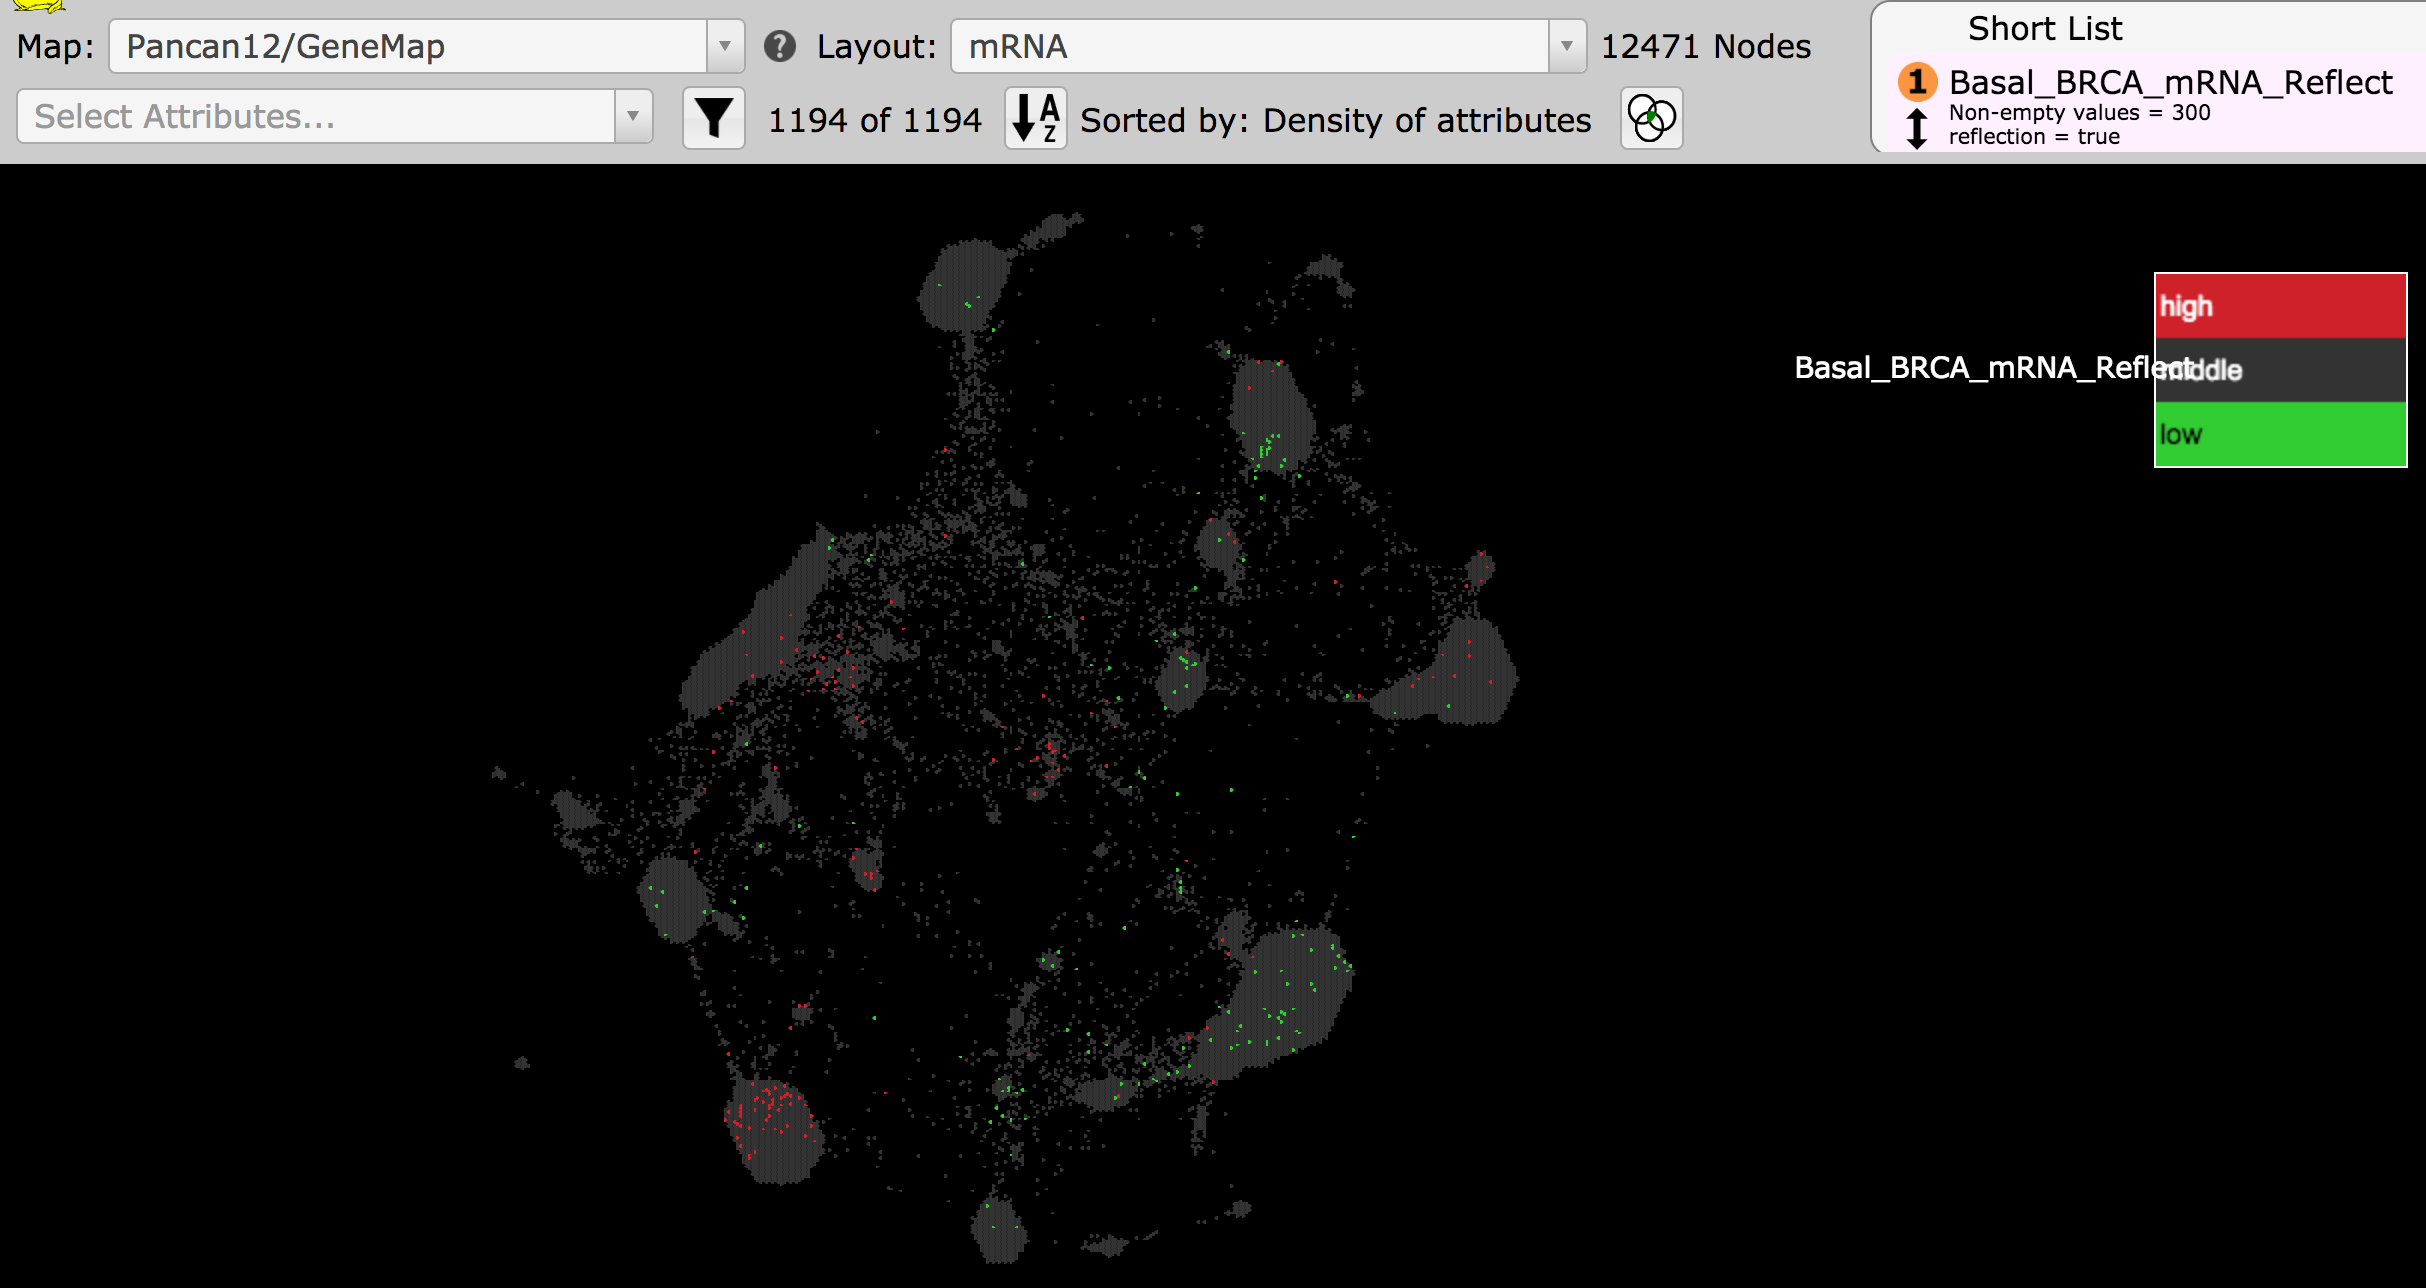
- The reflection target map, Pancan12/GeneMap, will open in another tab of your browser with the reflection data displayed as the attribute, Basal_BRCA_mRNA_Reflect. Enrichment of high genes are shown in red, while enrichment of low genes are in green. Grey indicates genes that are not drivers of the clustering of the basal BRCA samples.
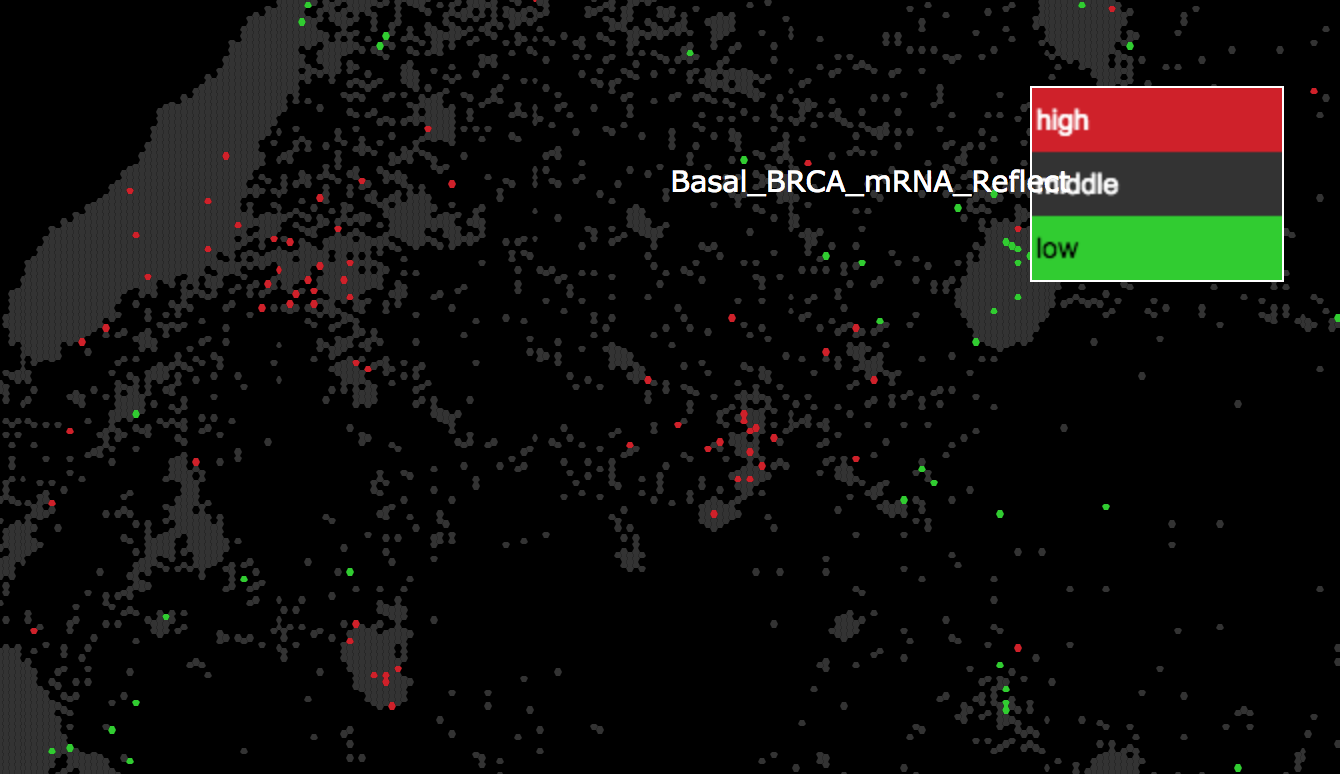
- Zoom into the regions enriched in high genes and position that region in the middle of your screen. Examine these regions by eye.
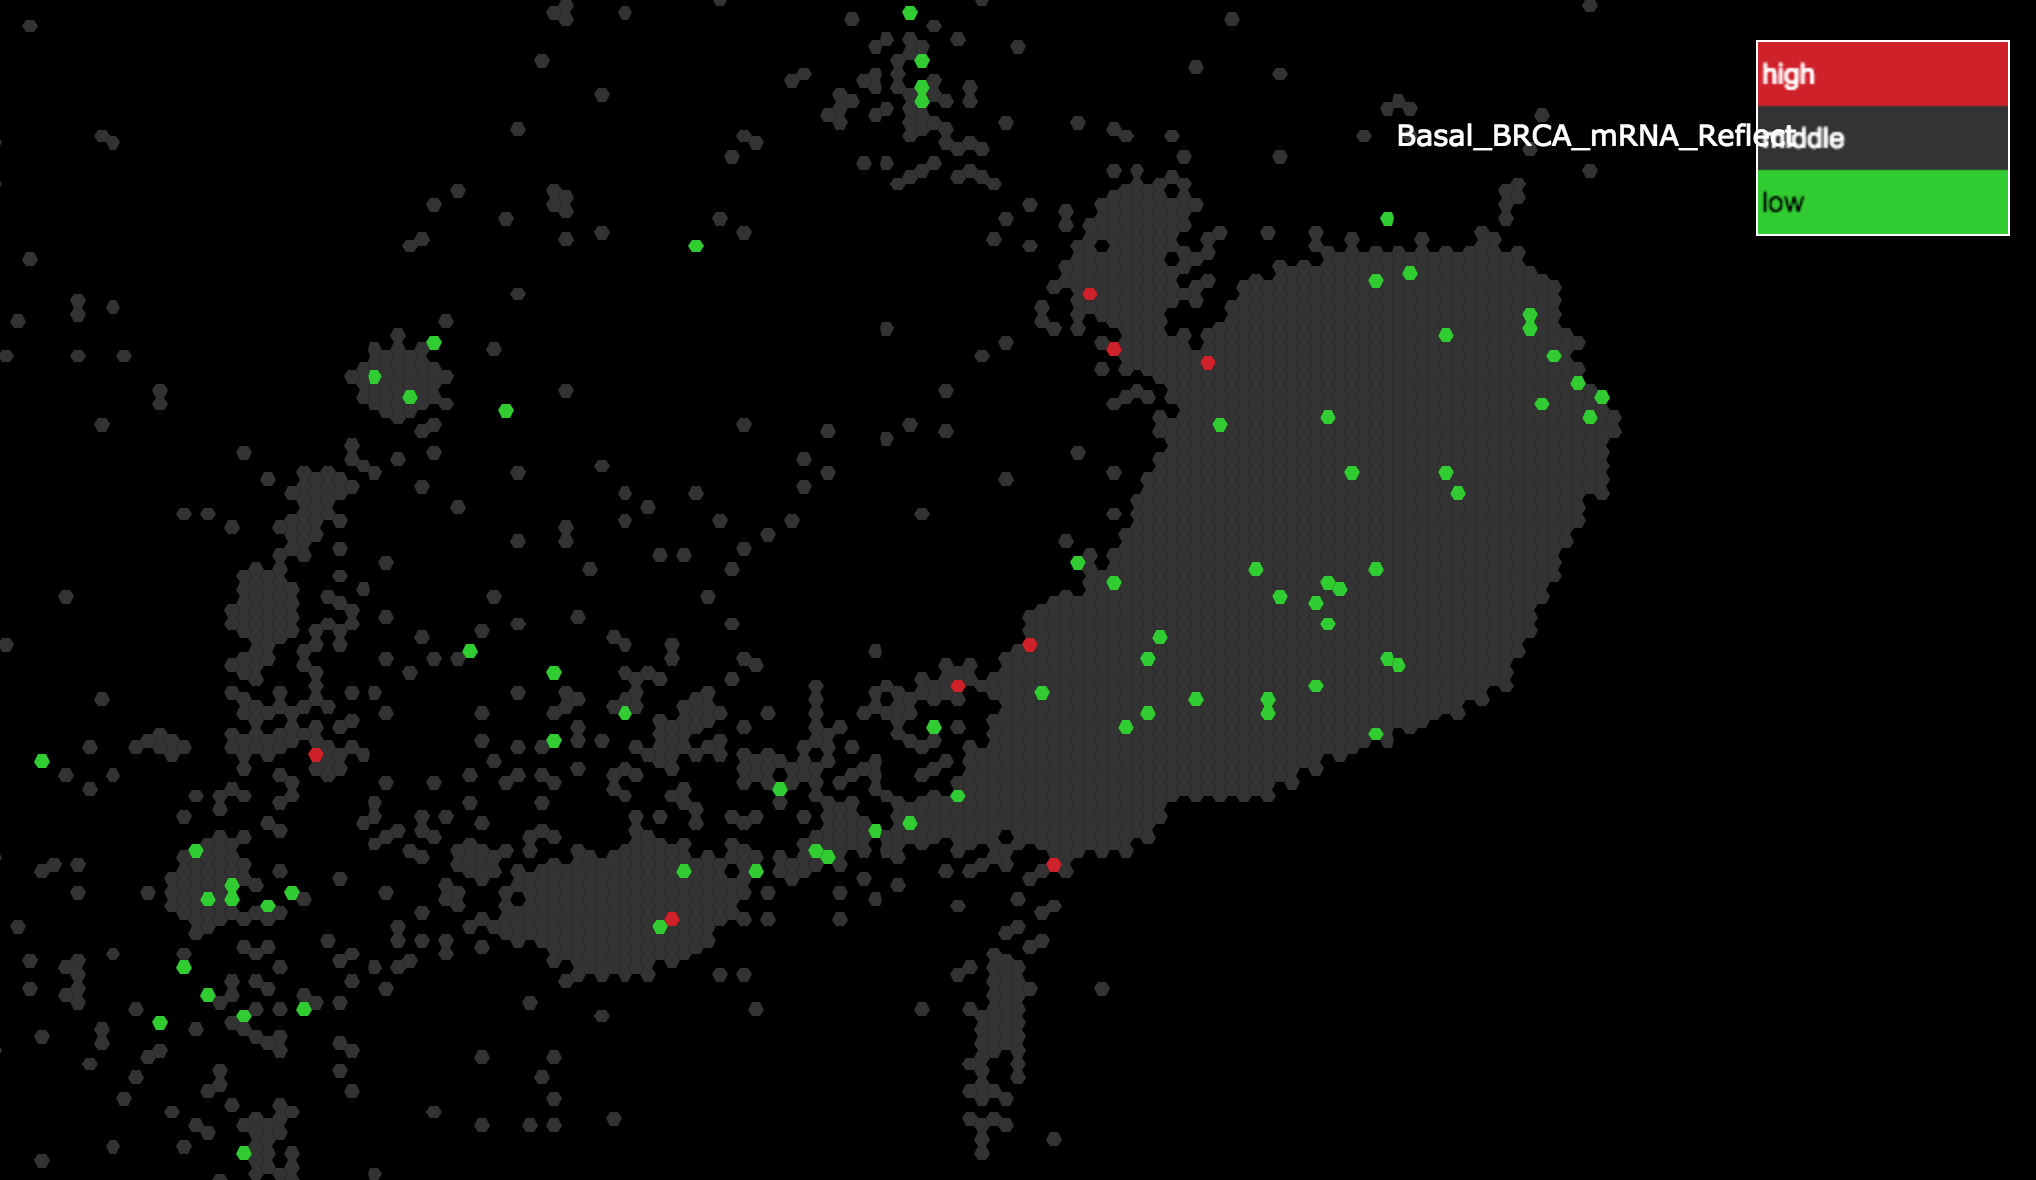
- Repeat the same steps as above to examine the regions enriched in low genes.
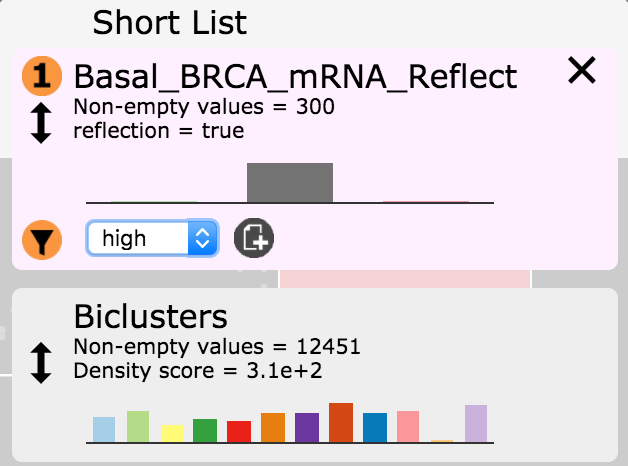
- In the Short List Basal_BRCA_mRNA_Reflect entry click on the filter button
and select high in the drop down menu. Then
click the create attribute button . Name this attribute
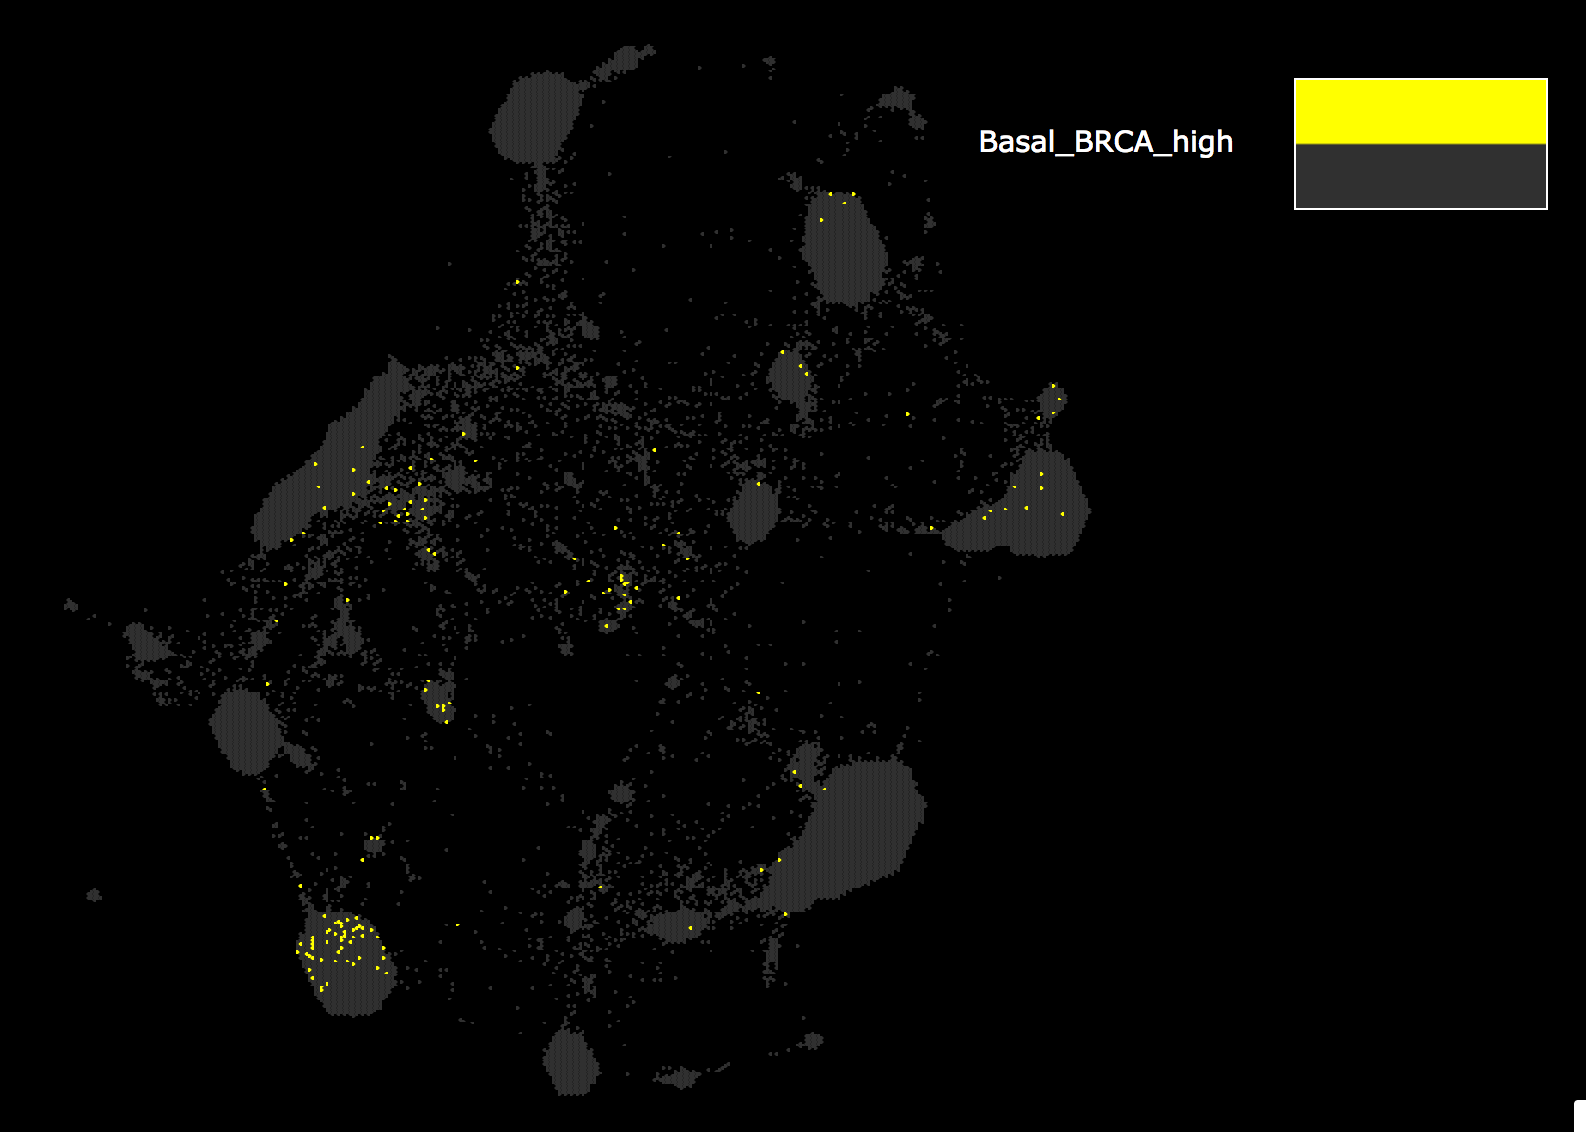
Basal_BRCA_high.
Zoom out to observe all the genes highlighted as being high in Basal BRCA clustering.
Note: these are the same genes that were colored red in step 3.
- Hover on the File menu, then hover on Download, then click on Node IDs.
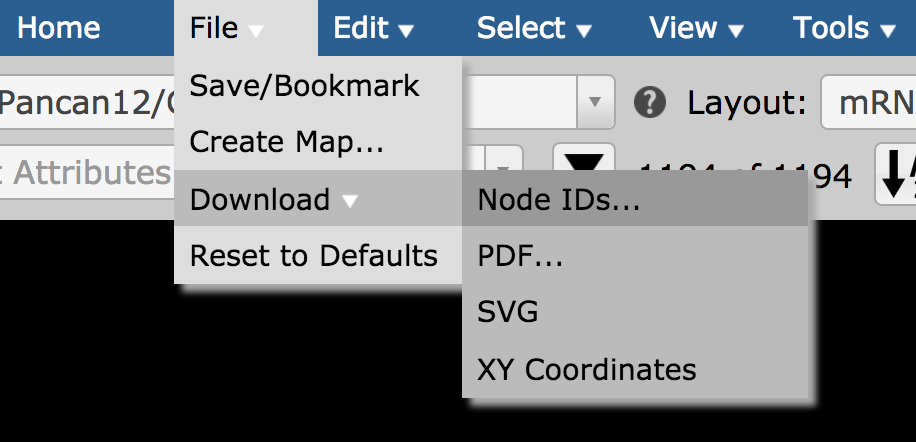
In the export window make sure Basal_BRCA_high is selected and click on Download As Text. Save this list as a file to your local directory.
Note: you are now able to do additional downstream analysis with this gene set. (e.g. gene set enrichment analysis, subnetwork visualization, etc.)