Basic Controls
The controls described here are available on the map layout page so if you are on the home page, get to the map page with a click on a map thumbnail.
Basic TumorMap controls include the ability to navigate the map, color the map and view a node’s details.
Navigate the Map
Zooming and panning are identical to that of a terrestrial Google Map.
To zoom you may use the
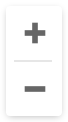 controls in the lower right of the window,
or the +/- keys on your keyboard.
controls in the lower right of the window,
or the +/- keys on your keyboard.
To pan or move around the map, click and drag the map, or use the left and right arrows on your keyboard.
Color the Map by Attribute
Nodes in the map are colored by attribute values. This allows you to visually explore the attributes and their relationships to the layout and to each other.
To select an attribute for coloring the map, click on Select Attributes and type in a few letters within the attribute name. If it exists, it will be displayed along with other attributes matching the string. Click on the attribute to color the map with those values. The attribute will appear in the Short List at the upper right of the map . The Select Attributes drop down contains all the attributes available for the map, while the Short List contains only those attributes that have already been selected.
The statistics display is explained at Attribute Information, with a technical discussion at Statistics and Sorting Tool.
To Select attributes for display click on the ![]() or
or ![]() in the
Short List entry.
No more than two attributes may be selected to color the nodes at a time.
in the
Short List entry.
No more than two attributes may be selected to color the nodes at a time.
Clicking on ![]() or
or ![]() will turn that attribute
display off.
will turn that attribute
display off.
More information may be found at Short List.
Header Anatomy
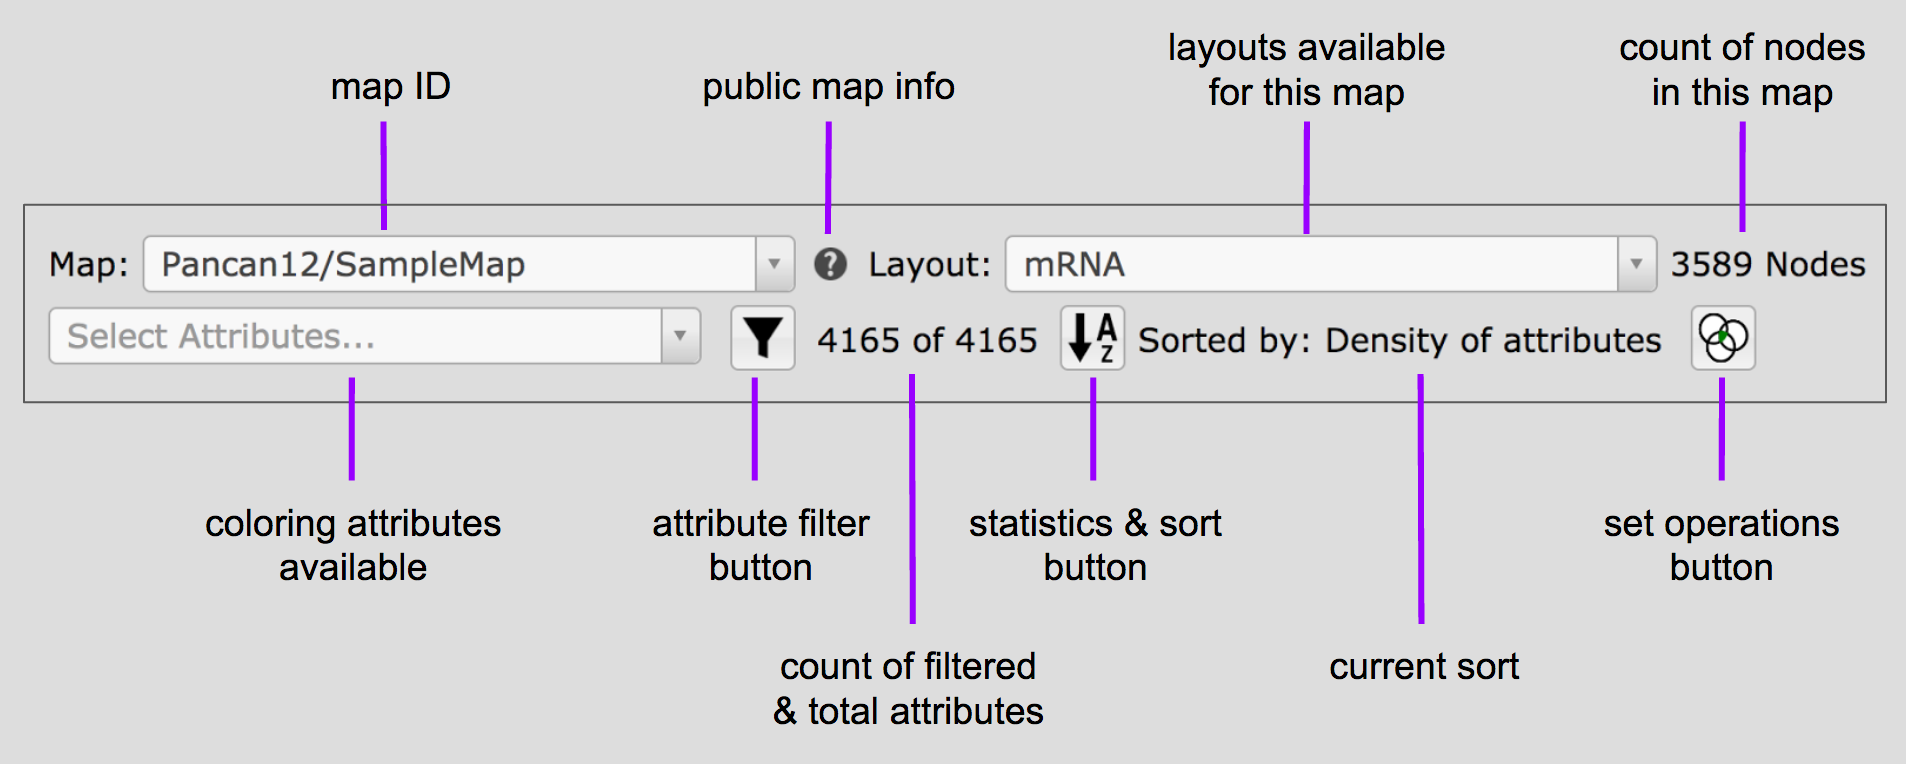
attribute filter button and count of filtered and total attributes are explained at Filter Attributes Tool
statistics and sort button and current sort are explained at Statistics and Sorting Tool
set operations button is explained at Set Operations Tool
coloring attributes available is explained in the section above, Color the Map By Attribute
View a Node’s Details
In order to view information about the specific nodes in the map, just click on the node. You may need to zoom in for the nodes to be big enough to click on the node of interest. This window will show the values of any attributes in the Short List.